For companies targeting growth and maturation of their offerings periodic reviews are necessary to understand the value they bring to market. The data gathered during this process is often considered to be impersonal, boring, and clinical, but it doesn’t have to be. If the data is humanized and the focus is on the people behind the work and their personal growth targets, we can create something delightful. In this way we don’t have to decide between clever or useful.
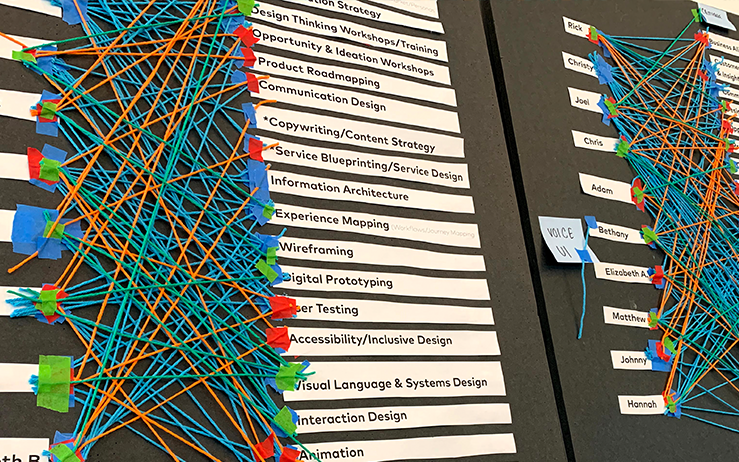
With this in mind the design team at Vervint set out to put this into practice. Our goal was to take a humanistic approach and gather data to learn more about our team. First, we surveyed the team about their skillset, strengths and weaknesses, and their goals. To keep the focus in the team we tested out the questions and even ran an physical exercise to get everyone involved.
Delightfully Human Data
After gathering the data, the next step was to visualize it in a meaningful way. To create delight for our audience we wanted the data visualization to be personal and fun.
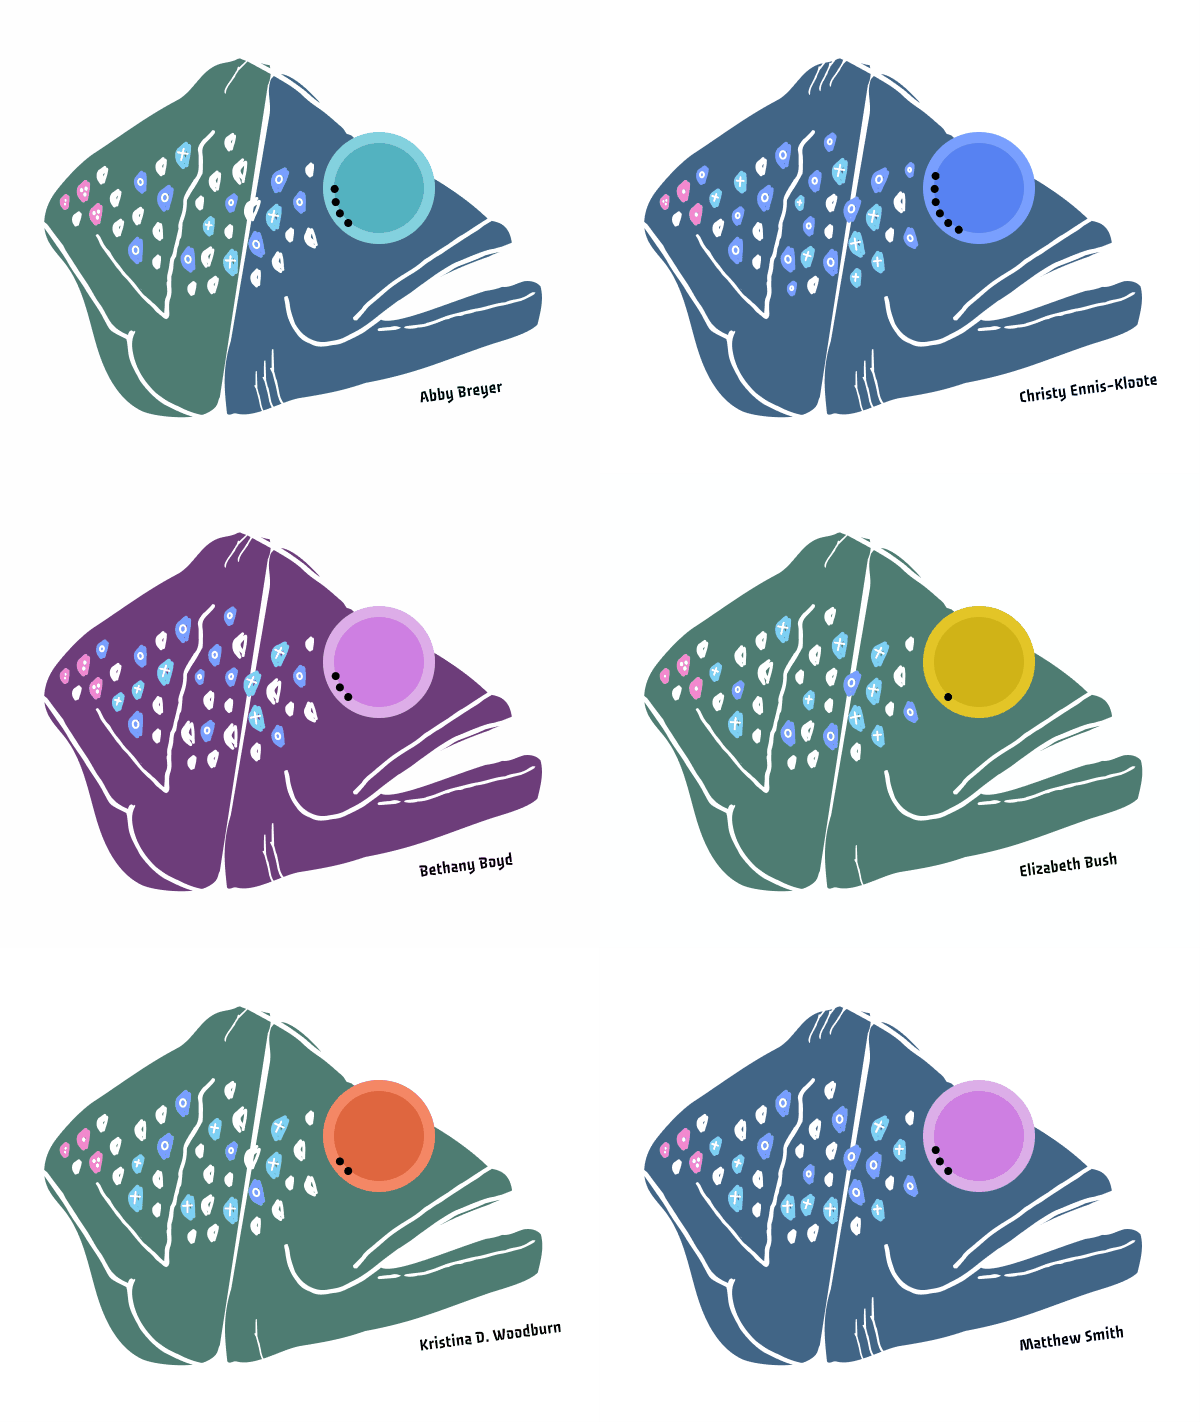
So we created data portraits in the form of fish heads…
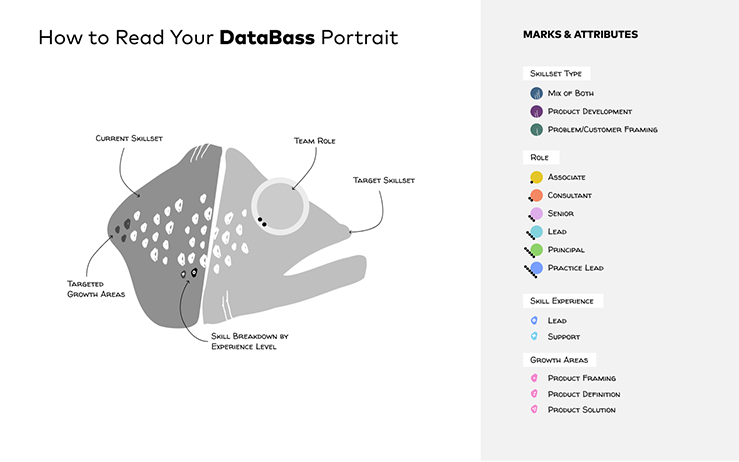
I should back up for a moment. The design practice at Vervint has a long running joke involving Bass. This joke goes way back to the formation of the design practice and even pre-dates it. I couldn’t tell you what the original story is, it’s before my time, and much like the Templars or Stone Masons, only a few souls know the truth. But that didn’t stop us from using the idea to create a set of delightful DataBass (get it, database… ) Portraits for each member of the team.
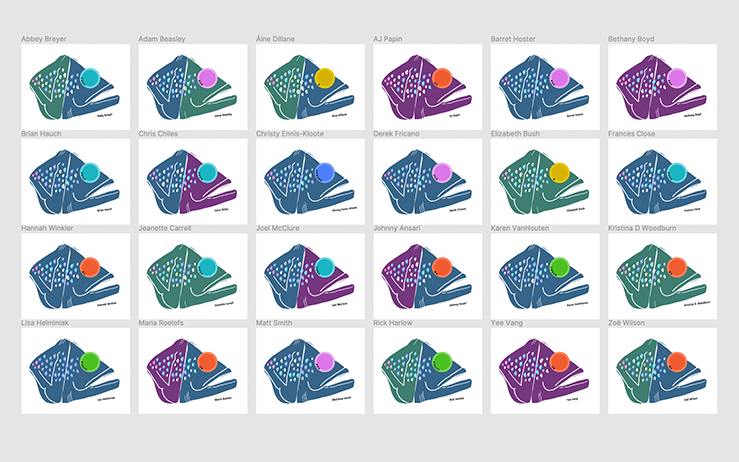
We humanized the data by focusing on what we wanted to learn about each member of our team and creating data portraits that represented each person. And when viewed as a group you can start to see high level patterns about the diversity of roles, skillsets, and capabilities.
Creating Value for the Business
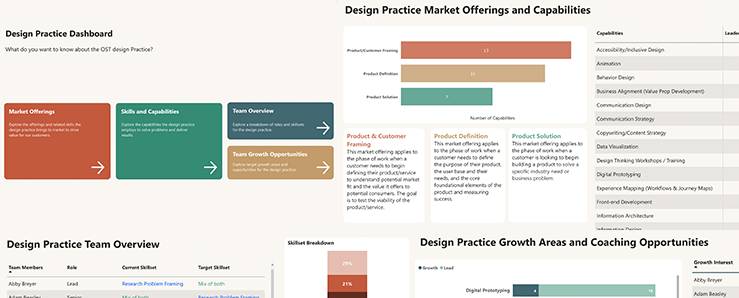
We had our fun with the data portraits, but we still wanted to show how taking a human centered approach to data analysis can have a positive impact on the business. For this we created a proof-of-concept in Power BI designed to visualize the data and show how it can be used across multiple levels of the business. To illustrate this, we used the report to answer three questions:
How can human centered data help the business?
We used the report to show how human centered data can inform a business-wide understanding of the people who do the work and develop a language used to describe skills and processes around the work brought to market. In the future, connecting this information with project management and time tracking data becomes a tool for identifying market need and individuals with skills or growth goals to fill those market needs. This becomes a powerful tool growing the business and customer relationships.
How can human centered data help at a practice level?
At a practice level, a human centered approach enables team leaders to learn about their team members skillsets and growth targets and use those to help bolster weaknesses in the practice. This becomes more powerful when used in conjunction with market offering data when understanding what services potential companies are looking for.
How can human centered data help individual team members?
At the micro level humanistic data enables individuals to learn more about their colleagues and further value can be seen when they are able to identify colleagues who are strong in skills they want to learn and reach out for questions or help.
